Dose Optimisation and Selection in clinical trials - Part 2: Data Analysis

August 20, 2025
Author: Miguel Pereira
In part 1, we discussed elements of trial design to address project Optimus. Now, in part 2, it is time to address the question that we get asked the most: How do we analyse the data to perform dose selection?
With this in mind, this article touches on the following points:
- Data analysis to support dose optimisation
- Cogitars’ solution for dose selection
- Other solutions to support dose selection
- What sample sizes are adequate?
First and foremost: the analysis does not have to be complex.
Performing dose optimisation with relatively small sample sizes means we can’t do analyses with the usual statistical hypothesis tests. This is recognised in the Project Optimus guidance:
So, what analyses do we have to carry out?
Data analysis to support dose optimisation
The data analysis required to perform dose optimisation is perhaps one of the most frequent areas of confusion. On one hand, we have somewhat small sample sizes and, therefore, cannot perform any statistical hypothesis testing. On the other hand, we are supposed to show some evidence that one dose is optimal based on all the safety, PK, PD and efficacy data.
The goal is to perform a set of analyses that show that a given dose is sufficiently safe and efficacious and has the best balance between the two. With this in mind, the FDA has the Oncology Dosing Tool Kit set which recommends a set of analyses to be carried out: https://www.fda.gov/about-fda/oncology-center-excellence/oncology-dosing-tool-kit.
Most of the analyses are of a descriptive nature and are included in the outputs normally created for a Clinical Study Report. Nonetheless, these are not entirely sufficient and, at the bottom of the list, there is the following:
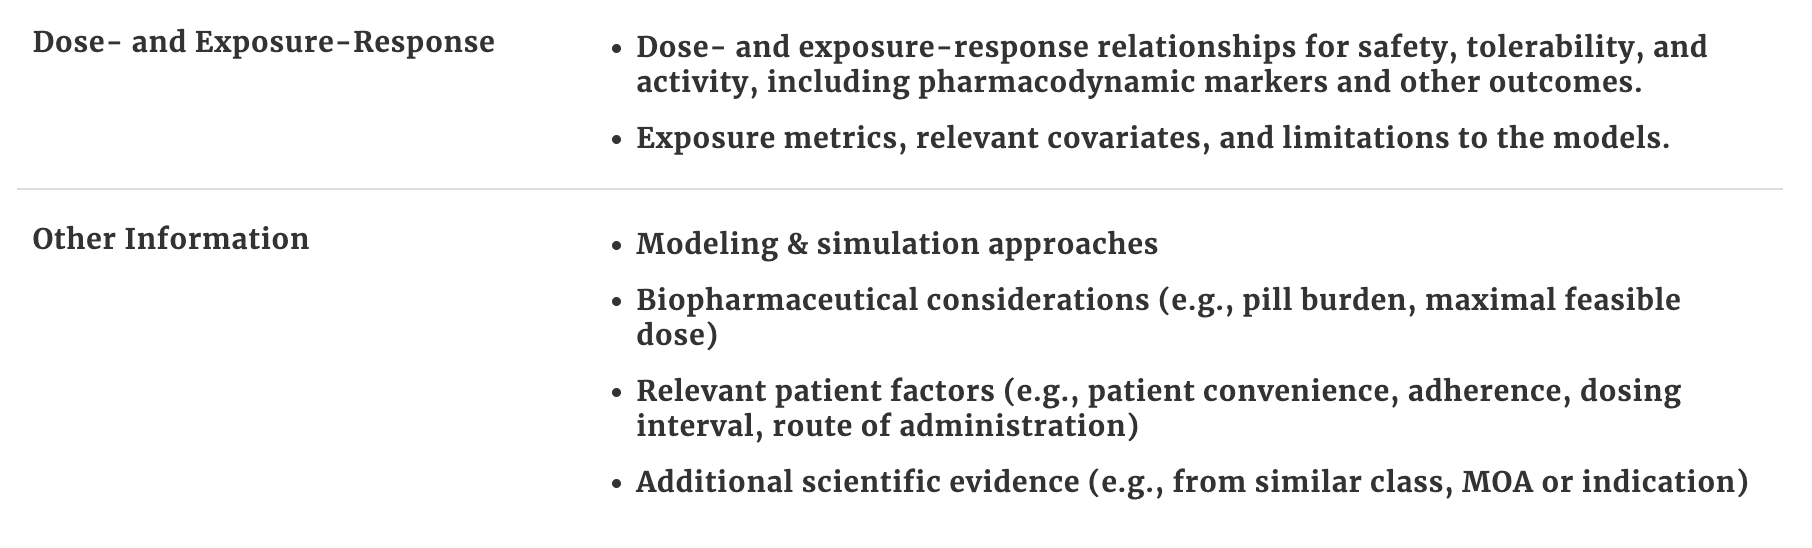
Dose- and Exposure-Response analyses, even if of a descriptive nature, are extremely important to define the optimal dose. Here are some example outputs that are useful:
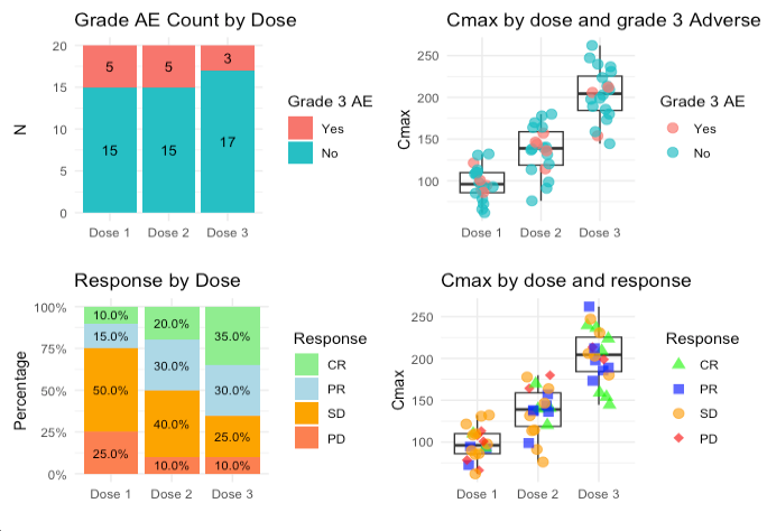
These outputs show:
- Dose - Safety relationship by looking at the frequency of grade 3 Adverse Events (AEs) (top left)
- Dose - Response relationship by looking at the breakdown of responses (according to the RECIST1.1 criteria in this case) per dose level (bottom left)
- Dose - PK - relationship by looking at the distribution of Cmax across the different doses. In addition, patients that experienced grade 3 AEs can be coloured to see also if higher Cmax is associated with more grade 3 AEs. The same can be done with other PK parameters (top right)
- Dose - PK - Response relationship - in this case using Cmax again and colouring patients by type of clinical response according to the RECIST criteria (bottom right)
Overall, in the small sample size scenario, these descriptive analyses can go a long way. These analyses will go to an End of Phase 1 report and the main point to focus should be to gather a set of data on the doses of interest in order to create a good argument to support a dose choice.
Cogitars’ solution for dose selection
In order to further support decision-making in dose optimisation, we developed a methodology to compare different doses to each other. This is a case where Bayesian statistics is handy since traditional hypotheses tests cannot be used.
The method is a Bayesian approach that estimates the probability that one dose level is superior to another with respect to an endpoint and it can be applied to any binary endpoint.
We are also currently working on extending it to time-to-event endpoints (e.g. progression-free survival) where the method estimates the probability that, for example, the PFS is greater in one dose versus another.
How does this solution work?
Our method computes the probability, based on the data, that the Overall Response Rate (ORR) for Dose X is greater than the ORR of Dose Y - that is, .
The table below shows an example with a set of probabilities for the comparison of 3 doses levels based on two efficacy (ORR and Duration of Response (DoR) at 6 months) and two safety (rate of grade 3 AEs and Adverse Events of Special Interest (AESI)) endpoints. In summary, Dose 2 shows the better profile which suggests it is the optimal dose:
Endpoint | Probability | |||
|---|---|---|---|---|
Dose 3 > Dose 2 | Dose 2 > Dose 1 | Dose 3 > Dose 1 | ||
Efficacy | ORR | 20% | 81% | 89% |
DoR at 6 months | 15% | 69% | 77% | |
Safety | Grade 3 AE rate | 75% | 42% | 90% |
AESI | 60% | 34% | 84% | |
In this example, we have doses 1, 2 and 3, where dose 1 is the lowest dose and dose 3 is the highest dose. What we are testing is the probability that Dose A > Dose B for each of the 4 endpoints.
For example, for the ORR, the table shows that there is a 20% probability that the ORR in dose 3 is greater than the ORR in dose 2 and that there is an 81% probability that the ORR in dose 2 is greater than the ORR in dose 1. This suggests that in respect to the ORR, dose 3 and dose 2 have similar efficacy and that doses 2 and 3 have both higher efficacy than dose 1 (dose 3 with 89% chance of having a higher ORR than dose 1).
Defining the Optimal Biological Dose (OBD)
In the example above, dose 2 seems to be the OBD because both ORR and DoR at 6 months are relatively similar to dose 3 (dose 3 is only 20% and 15% more likely to be superior in efficacy for each of these endpoints, respectively) and dose 1 is much inferior in efficacy with ORR being 81% more likely to be higher in dose 2 than 1 and DoR at 6 months 69% more likely. Moreover, when we look at safety, dose 2 shows a better safety profile than dose 1 with the rate of grade 2 Adverse Events (AEs) being only 42% more likely to be higher in dose 2 and the rate of Adverse Events of Special Interest (AESI) 34% more likely. In contrast, dose 3 seems less safe than dose 2 with a 75% change of having a higher grade 3 AE rate and a 60% of having a higher rate of AESI.
This analysis contributes to decision-making and in gathering evidence to support a choice of OBD. It is important to remember, nonetheless, that a collection of multiple types of data that is wider than the endpoints included in this approach is necessary.
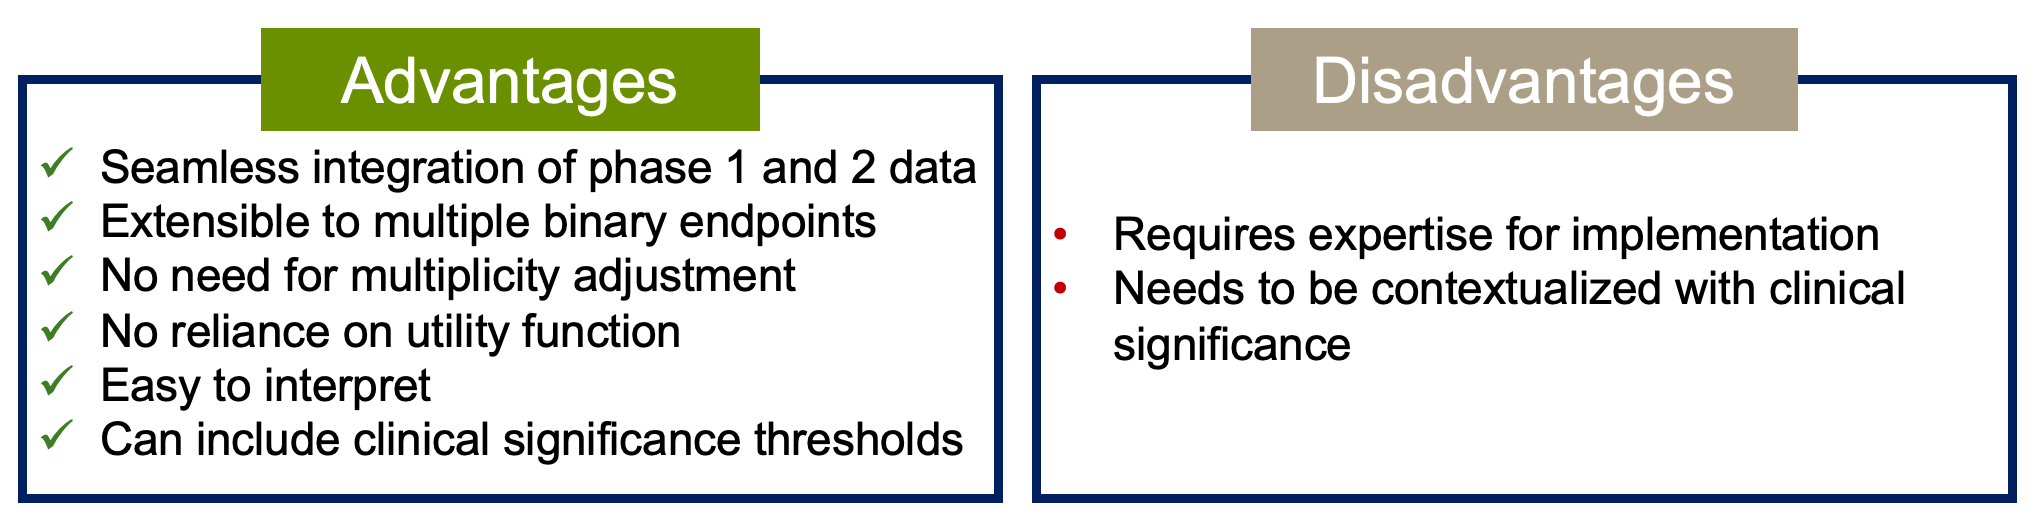
What are the Advantages and disadvantages of this methodology?
Other solutions to support dose selection
There are other statistical methodologies to perform dose optimisation. Overall, all the approaches depend on the use of a utility function. A utility function is useful when we want to set a preference for a set of possible outcomes. To be more precise, we can formulate the problem as a balance act between safety and efficacy.
This means we have 4 options:
Drug | Efficacious? | ||
|---|---|---|---|
Yes | No | ||
Safe? | Yes | 75% - option 1 | 15% - option 2 |
No | 10% - option 3 | 0% - option 4 | |
A utility function is set by assigning weights to each of these outcomes. Clearly, we don’t want a drug that is not safe nor efficacious, so the weight for that option should be set to zero. On the other hand, it’s very clear that we want a drug that is both safe and efficacious, so this should be the option with a higher weight. The question now is, what is an appropriate or meaningful weight? Is 50% enough? Or perhaps it should be 100%?
Where things become even trickier is when we have to assign weights for the options where the drug is safe but not efficacious (option 2) or is not safe but efficacious (option 3). In the end, our weights could be 75%, 15%, 10% and 0% for options 1 to 4, respectively. These weights should be elicited from clinicians with expertise in the therapeutic area and/or disease in question.
Overall, my personal view is that we should not use methods based on a utility function. This is for two reasons:
- It is very difficult to accurately assign the weights. Sure, it’s possible to elicit these weights from clinicians. If you ask, you will get an answer, but is it a good one? Doing this elicitation is similar to taking opinion as deterministic ‘evidence’, which could even overrule the evidence from descriptive statistics.
- Utility functions assume that safety and efficacy are simple Yes/No endpoints. In reality, both safety and efficacy are measured by looking at many endpoints, such as number of AEs ≥ Grade 3, serious adverse events or AEs leading to death, as examples of safety; efficacy can also be measured by overall response, progression-free survival or clinical benefit rate, among many others. This granularity is not considered in approaches that use an utility function.
Methods that use utility functions
There are several published methods that balance efficacy and safety. A detailed description is beyond the scope of this article but here are three examples:
- Efftox - It is one of the oldest methods that balance efficacy and toxicity, published in 2004 by Thall and Cook. This method is model-based, that is, it considers a dose-toxicity and dose-response curve for toxicity and efficacy, respectively. The optimal dose is selected as the dose with maximum utility. It can be used for dose optimisation/selection after the trial is completed or during the trial to guide dose escalation decisions.
- U-BOIN - This is a variation of the Bayesian Optimal Interval (BOIN) method used for dose escalation adapted to include a utility function hence the name Utility-BOIN. It is split into 2 stages where stage 1 is only about toxicity (it is essentially the standard BOIN design) allowing for dose escalation irrespective of efficacy. Stage 2 includes both toxicity and efficacy to find the optimal dose according to pre-defined utility.
- BOIN12 - Another variation of the BOIN design. Unlike the U-BOIN design, this is a single stage design and it operates essentially like the standard BOIN design. At the end of the dose escalation, once the efficacy data has been collected, the BOIN12 combines the information from both toxicity and efficacy into a desirability score - Rank-based desirability (RDS) - which is computed based on the parameters of the utility function. The dose with the highest RDS is the OBD.
- There is also a variation that includes time-to-event outcomes called TITE-BOIN.
For more information on the two BOIN variations, visit https://trialdesign.org/ which has links to all the original publications as well as web apps to use them.
What Sample sizes are adequate?
To finalise, some remarks on what sample sizes should we use for each cohort when performing dose optimisation.
The FDA states that ‘The trial does not need to be powered to demonstrate statistical superiority of a dosage or statistical non-inferiority among the dosages using Type I error rates which would be used in registrational trials’.
We recommend enrolling at least 20-30 patients per cohort. Larger cohort sizes may be warranted depending on the specific analyses required and future development plans (e.g., potential registrational trials or key efficacy endpoints). However, increasing cohort size should follow a stepwise approach (e.g., 10+10+10) until sufficient evidence for differentiation is obtained. Smaller cohorts may be appropriate if different formulations, schedules, or regimens are being evaluated.
Why is 20-30 a good number?
In the Bayesian probability of success design framework, sample sizes of 20-30 subjects show good precision in the determination of efficacy endpoints with probabilities of success.
Also, the analyses should not focus only on the current sample of subjects but on all the subjects treated in previous trials. To that effect, for example, in a seamless phase 1/2 trial, you could have 6 subjects in each of two cohorts in the dose escalation and then add 14 subjects to each cohort with randomisation for dose optimisation.
Concluding remarks
The Project Optimus guidance has brought clarity on how oncology drug development should shift its focus from maximum tolerated dose to optimal biological dose. While this is a very positive change, it generated multiple questions and discussions among sponsors.
This 2-part article about Project Optimus was the product of several discussions with sponsors, adaptations to trial design and method’s development that we have carried out. I hope it helps clarify the process. Keep on trialing.